Are you using an ultrasonic humidifier at home? If so, you are making lots of lots of particulate matter!
We are happy to share our new paper by Lau et al., published on Indoor Air, the flagship journal in the field of indoor air quality. Congrats to Chester, Max, Tania, and Keifer!
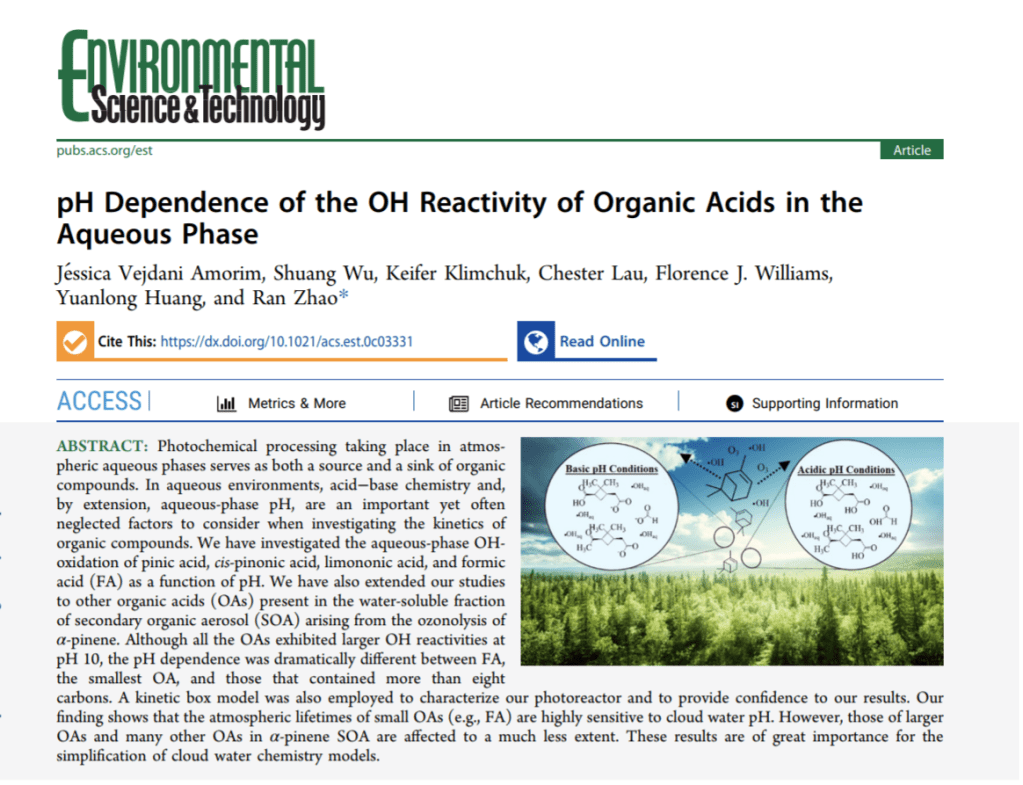
Jessica’s first-author paper is now published online in Environmental Science & Technology, a top journal in the field of environmental chemitry. A big congratulations to Jessica, as well as Shuang, Chester, and Keifer who are listed as coauthors!
Congratulations for Jessica, Tania, and Max for each delivering an excellent poster presentation at the American Geophysical Union meeting at San Francisco in Dec. 2019!
Our group has already started making contributions to the larger research community!
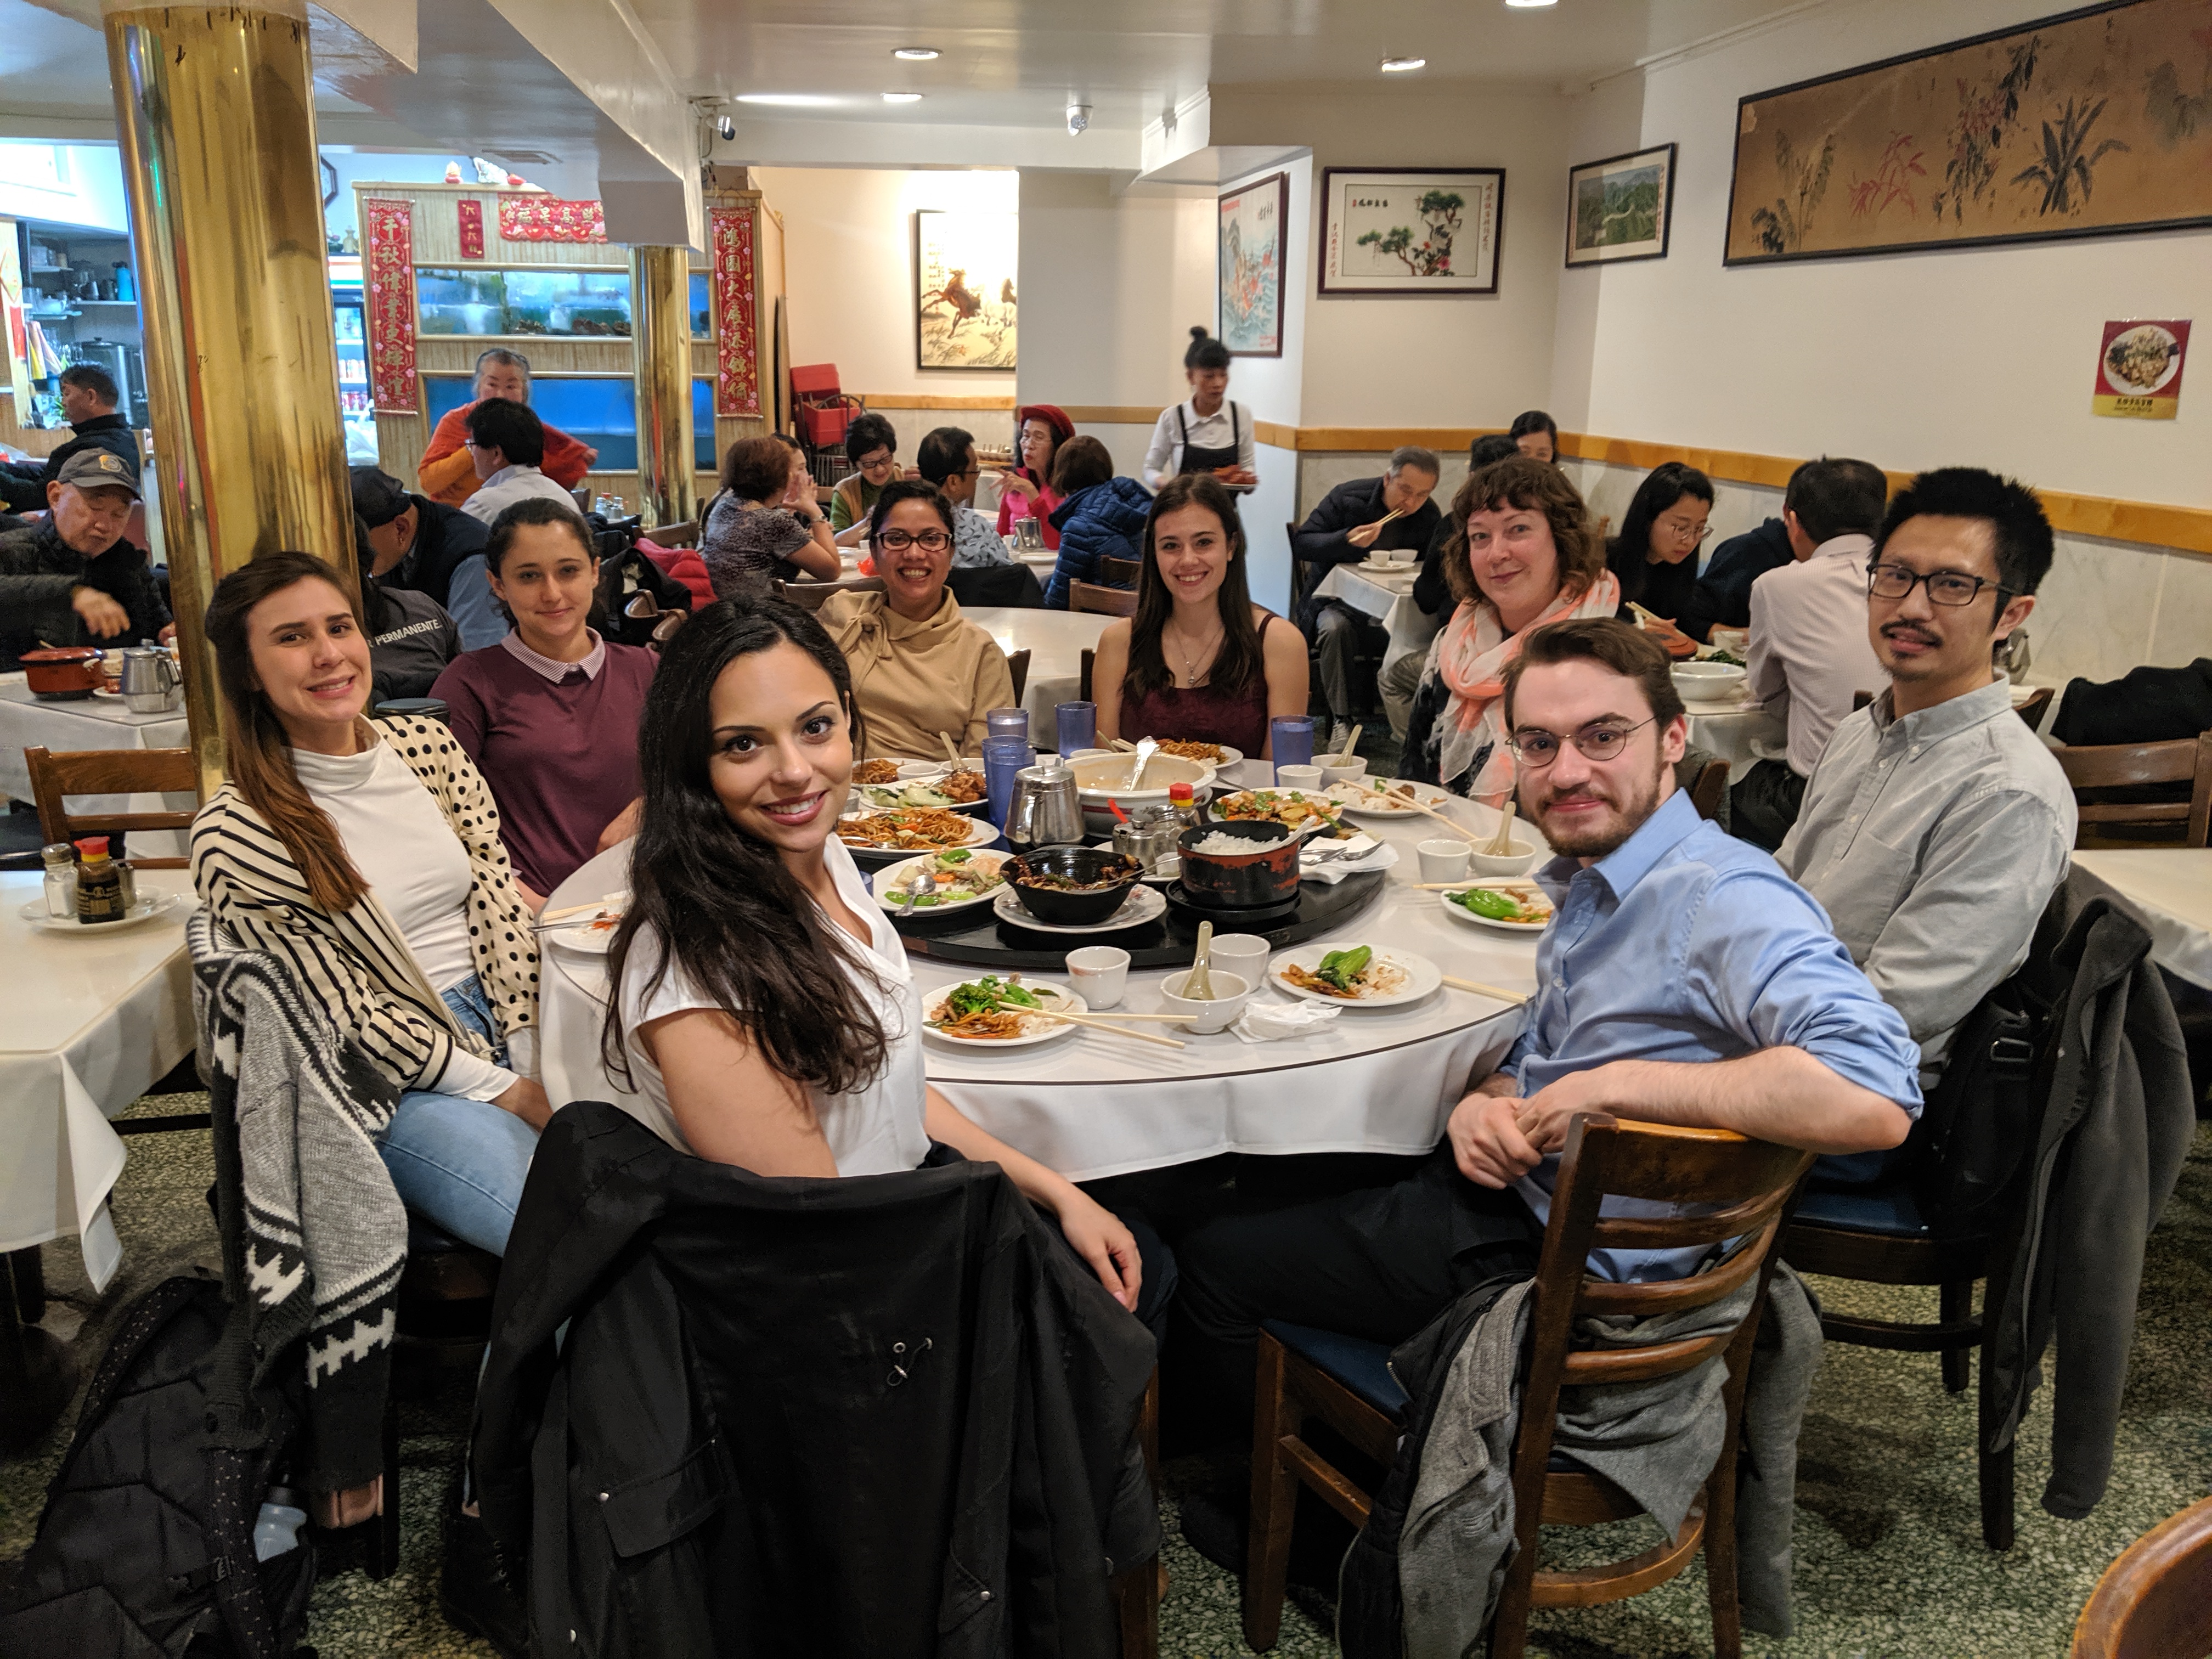
Picture: a mini U of A dinner with Sarah Styler’s research group!
Ran is feeling honored for an opportunity to introduce the research done at the Zhao group in front of the Honourable Kirsty Duncan, Ministry of Science and Sports, the Honourable Amarjeet Sohi, Minister of Natural Resources, and the U of A president David Turpin.
They were impressed by and appreciated the hard work everyone had done in the lab. Congratulations to us all!
The first Prairie Environmental Chemistry Colloquium (PECC) was hosted at the U of A on May 13 and 14. PECC is a regional academic conference with a theme on environmental sciences. This year, we welcomed attendees from the U of A, the University of Saskatchewan, MacEwan University, the University of Calgary, and Mount Royal University. We also had the pleasure to invite Dr. Lynn Mazzoleni (Michigan Tech), Dr. Alvaro Osornio-Vargas (U of A), and Dr. Charlene Nielson (U of A) as our plenary speakers.
PECC featured two full days of student presentations. Jessica, Tania, and Max each gave an oral presentation, while Keifer, Jeff, Meng, Chester, and Sophie each presented a poster on their respective research project. Well done everyone!
The Zhao group members also made significant contributions to the organization of PECC. The conference was organized as a joint effort of the Zhao group and the Styler group at U of A. Jessica, Max, Tania, and Meng were actively involved in the organizational committee. Congratulations for their achievement!
Ran was awarded this year’s Yuxiang Young Scholar Award, an award to recognize outstanding Chinese and Chinese-American young scholars in oceanic and atmospheric sciences and related fields.
The award is issued by Chinese-American Oceanic and Atmospheric Association (COAA).
This blog post was written on the night of Aug. 8th. A lot of people have noticed that the sky has been very hazy over the past couple of days (Aug. 7th and 8th). The news is blaming wildfires burning in BC (CBC news).
Can fire as far as BC affect the air in Edmonton? What is the evidence of it? As an atmospheric chemist, I’ve decided to do a little research on my own.
First of all, I did something I used to in my hometown, Beijing: a clean day vs. a polluted day! Here are pictures of North Saskatchewan river I took on Aug. 6th (top) and Aug 8th (bottom):
It does look pretty bad on the 8th, isn’t it? Is it bad for our health? Yes, it is Unhealthy, according to air quality index (AQI), a measure of outdoor air quality.
Source: Air Pollution in the World Real-Time Map: http://aqicn.org/map/world/
How does the number, 158, compare to other cities? Just for your information, the AQI values at the same time in Beijing, New Delhi, and Los Angeles were 78, 65, and 42, respectively. Of course, AQI depends on numerous factors, such as time of the day, meteorology, etc. But I’m just simply amazed that Edmonton at this moment was more polluted than all of those famous air pollution capitals in the world! By the way, AQI in Beijing on a bad day can reach 500…
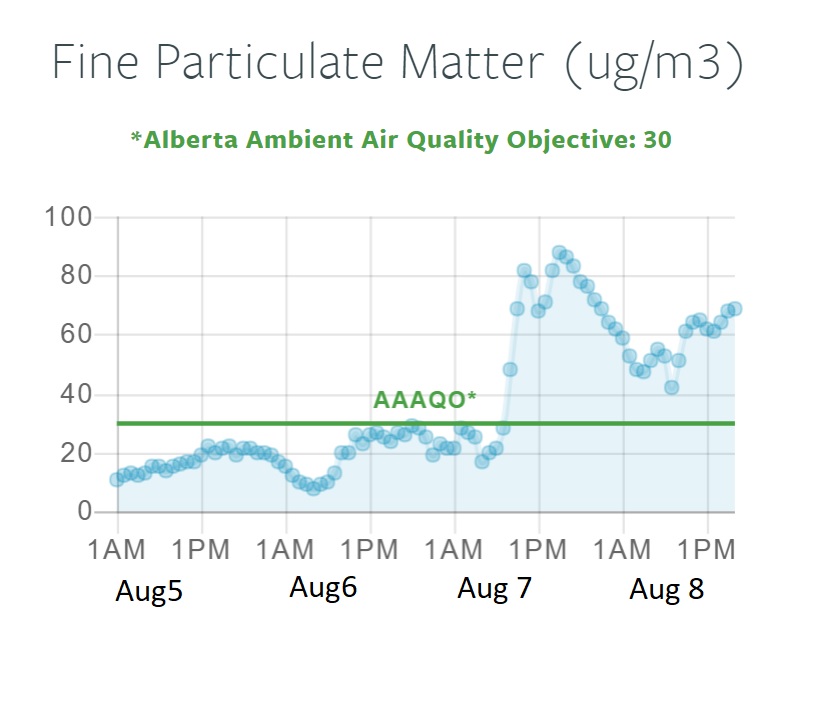
Back to the Edmonton story. It is obvious from the figure above that it’s PM2.5 that’s driving the bad air quality. PM2.5 represents particulate matter smaller than 2.5 micrometer and is one of the foci of my research. In the chart below, I refer to the real-time measurement data of PM2.5 offered by Alberta Capital Airshed. The data was taken at the Edmonton East cite, near where the polluted North Saskatchewan river picture (above) was taken.
The observation is striking: PM2.5 concentration rapidly increased in the morning of Aug. 7th, to a level triple that of Alberta Ambient Air Quality Objective.
Is this sharp rise of PM2.5 really due to wildfire in BC? The best way is to look from the sky – from the Satellite!
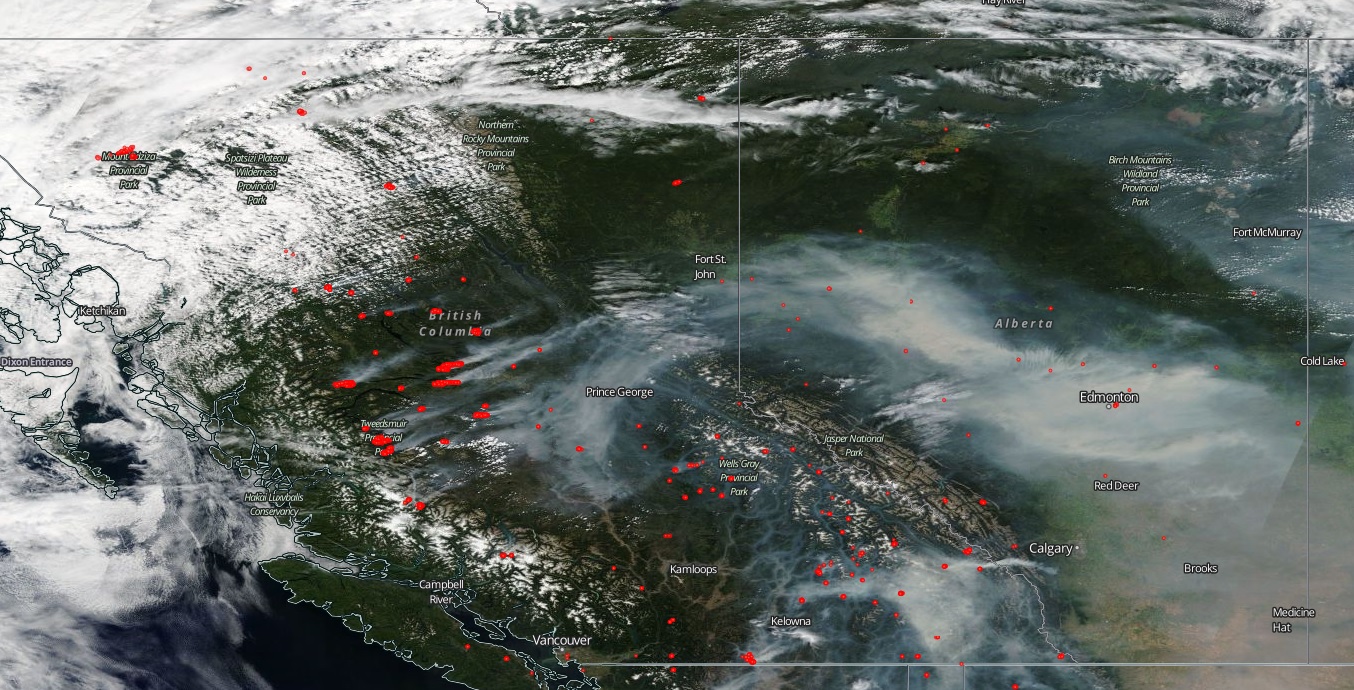
I’ve taken the NASA satellite image for the past week, and here is a animation showing the day-by-day image of BC and Alberta. The time stamp is shown in the left-bottom corner. The red dots correspond to wildfires recorded by the satellite.
Source: NASA Earth Data https://earthdata.nasa.gov/earth-observation-data/near-real-time/firms/active-fire-data
There are a few key observations from this animation. First, we can see that wildfires developed rapidly over the past couple of days, represented by the increase of the red dots. Second, the arrival of the smoke corresponded to when the PM2.5 level sharply rose in Edmonton on Aug. 7th!
Just in case it was not obvious enough in the GIF animation, here is a stationary satellite image for Aug. 8th. Wow, Edmonton is right in the center of the fire plume!
I have to say that the result of my little research was beyond my own imagination. It’s shocking how significantly the recent wildfire event is polluting the air we are breathing. Edmonton is a city normally with air cleaner than anywhere in the world.
On the global scale, biomass burning is a major source of volatile organic compounds and particulate matter to the atmosphere. Understanding the chemistry of fire emissions is a hot research direction in Atmospheric Chemistry. The Zhao group is also planning to investigate biomass burning-related environmental issues but on a different setting. We are planning to investigate the environmental impact of solid fuel burning. Stay tuned for our up-to-date results!
Ran Zhao’s most recent 1st-author research article was published in the Journal of Physical Chemistry A on 21st May 2018.
The paper is about hydrolysis of a class of ester hydroperoxides that are playing an important role in the atmosphere. The major discovery is that this class of hydroperoxide hydrolyzes rapidly in cloud-water relevant aqueous phases. Currently, the chemistry of such complex, multi-functional organic peroxides in particulate matter is not well understood. This paper provides useful chemical insights into the behavior of such organic peroxide in the atmosphere.
This paper is also the result of a successful collaboration initiated by Ran between his research group at Caltech (PI Prof. John Seinfeld) and Prof. Suzanne Paulson’s research group at the University of California – Los Angeles.